Basketball API — Data Plotting Concepts
Coordinate systems, zone maps, and shot chart plotting for the ShotTracker Event API. Use these when building visualizations or interpreting location and shot data.
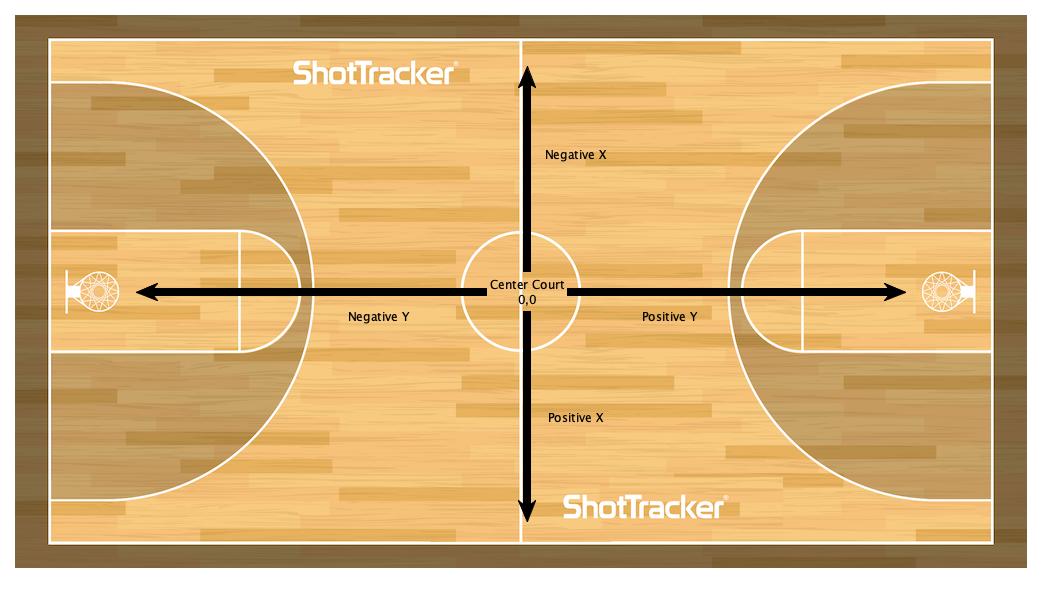
Locations XY Orientation
Full-court XY coordinate orientation for location data.
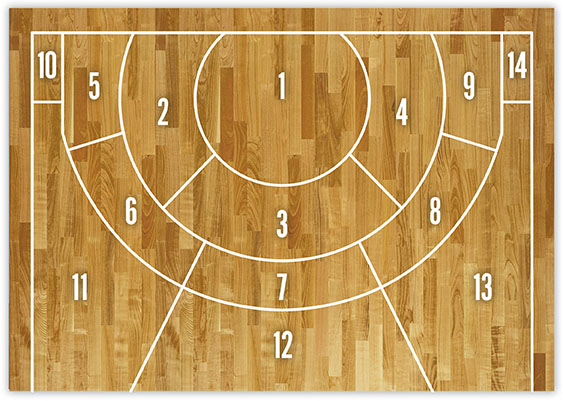
Zone Map Locations
Shots are assigned a zone number 1–14 that represents the specific location around the hoop the shot occurred. The map below shows the shot zones.
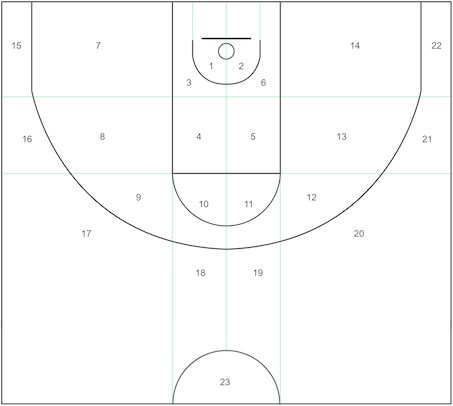
Advanced Zone Map Locations
Shots are assigned an advanced zone number 1–23 that represents the specific location around the hoop the shot occurred. The map below shows the shot advanced zone.
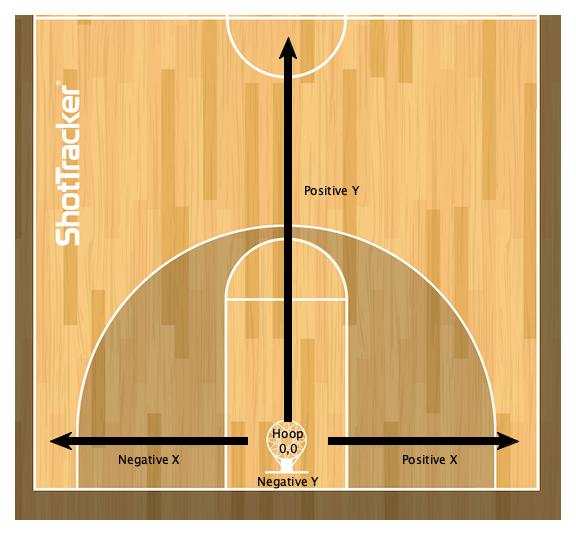
Shot Chart Plotting
Shot data contains hoop_player_x and hoop_player_y that represent the xy location of the shot from the hoop. Representing a shot from the hoop assumes that positive y runs from the hoop to the center of the court and positive x runs from the hoop to the right.